
Boxing Day Kaka Count– and some conclusions: How many pesky parrots in pohutukawas, plums or pines?
by John Ogden
Environmental News Issue 24 Summer 2011
Kaka is an endemic species, found nowhere else but New Zealand. Nationally kaka numbers have declined dramatically since European arrival, and continued to do so between nation-wide surveys in 1985 and 2004 (Robertson et al. 2007). Stoat- and Possum-free Great Barrier Island is recognized as one of the major kaka population centres, so it is important to get to know how many are here. There is also local concern about kaka numbers as they deplete yield on fruit trees and make orchards uneconomic.

Feeding kaka can become quite tolerant of human presence. Photo: IslandStay
A total of 5 kaka counts have been made on Great Barrier since the first boxing-day count in December 2007. After that, the next three counts were all made in the winter period, between 2008 and 2010. As the original boxing day count indicated much larger numbers of kaka than the subsequent winter counts, it was thought prudent to do another summer count to check that the seasonal differences indicated were real, and not just a consequence of huge ‘counter enthusiasm’ on the first count for instance! The ‘final’ count was on boxing-day 2010, and here I summarise the results for that count, and make comparisons with the earlier data.
First, it is very pleasing to report on the level of support shown to the Trust by participation in these counts. While I’m not so naive as to think that all participants support all the GBICT aspirations, presumably participation does indicate an interest in understanding more about this endangered bird. Ninety-one participants sent in 193 data sheets over the five counts, with 30 people participating in up to three counts (Fig 1). Participation per count ranged from 33 to 45 persons. Actually participation is greater than this, because some ‘participants’ were more than one person! Anyway, you all know who you are, so a big ‘thankyou’ from the Trust!
The Boxing-day 2010 results are in Table 1, which follows the format used in previous reports (GBI Environmental News #13, 16, 23). Individual sheets were grouped by ‘location’ (e.g. there were three sheets from Awana). The Total AM and PM are the sums of all counts by all observers and this assumes that all birds are different individuals. ‘Minimum at location’ takes the largest number actually counted by any observer at the location as the minimum that must have been present (i.e. there were at least that number). Maximum uses the largest ‘numbers usually seen over past two weeks’ or the largest count at the location on the day if that was greater.
Some quite large flocks were recorded in 2010, for example 39 birds at Tryphena and 26 at Whangapara-para. It is very difficult to count the birds in fast-moving groups flying or feeding, and it is likely that some birds were counted twice. However, in these two cases (and others), large numbers were also recorded by other observers at the location, so they are considered to be reliable.
All five data sets are compared in Table 2 and Fig 2. These results clearly demonstrate that numbers decline in winter, which coincides with an increase in numbers on the mainland (personal communications: Suzi Phillips; see www.kakawatchnz.org ). It is not known how the data in Table 2 relate to the true population size of kaka on the Island, as clearly not all individuals are counted on each occasion, and there may be double counting in some cases. “Maximum based on locations” is probably the best estimate, but this may underestimate numbers, especially in summer when the birds are more dispersed through remote bush areas for breeding. Overall it appears that the summer breeding population is between 200 – 300 birds (guess at probably < 100 breeding pairs), while the overwintering population is probably c. 125 birds ± 50.
Notes: nc = not counted. (1) This minimum is the maximum actually counted by one of the observers at a ‘location’ (i.e. at least this number was definitely present at the location). (2) This maximum is based on either the maximum actually counted by an observer at the location or (usually) the estimate of numbers usually seen by the observer over the last two weeks.
The data (Fig 2) might suggest that kaka numbers have increased in summer between 2007 and 2010. However, there is no proof that this is so because the error bars overlap. Moreover, one important location (Motairehe) wasn’t counted in 2007. This could easily account for the difference. It is also very difficult to separate real population changes from changes in conspicuousness in this species.
Movement from Great Barrier to the mainland appears to be in April and May, while the return is in September. Our previous (2006-08) Island-wide bird counts clearly show that by September kaka are as conspicuous in most places as they are in December (Table 3). Those results also suggest that the summer population is about twice the winter, though numbers remain in some locations where food is available.
Not everyone noted what tree species the kaka frequented; often they were only seen flying. However, the data set has 196 records of tree species visited by kakas, with roughly as many winter as summer records. If we express the records for each species as a percentage of all records (Table 4), and assume that presence in a tree is proportional to the value of the tree as a food source (an assumption that needs considerable qualification!), then we can make a few conclusions.
Native plants are most important in December. Pohutukawa (presumably mostly flowering) is top of the list, comprising 30% of all observations. Puriri and flax are also important. Fruit trees comprise 17% of observations, though of course many do not have ripe fruit in December. In the Winter native trees seem to be less important, but puriri (which carries some fruit almost throughout the year), is significant. Exotic trees, especially pines, gum trees and Banksia, seem to be important for the (smaller) overwintering population. Citrus are important in the orchard fruits category, which overall stays about the same as in summer (17 vs. 19%).
It would be unwise to make too much of these data, but they do seem to confirm the impressions gained from other observations; just as abundant food supply may trigger kaka breeding (Powlesland et al. 2009), food shortage may be what drives over half the birds off-island in the winter. At that time it is the exotic trees, especially pines, which comprise the main food source.
Exotic trees, especially pines, are seen mainly as problem ‘weeds’ on Great Barrier by the Department of Conservation and some land-owners. These data add another perspectives. Pines comprise an important food resource for kaka (perhaps more than 18% of calories in winter?). If exotics such as pines, macrocarpa, gums, Banksia, wattles and coral trees were totally removed from the Island, kaka would either leave for the mainland in winter – where they might be at much greater risk – or else seek other food sources. It seems most likely that they would turn to “fruit trees” rather than the native forest, which has so little food that half the population already leaves.
All we can really conclude from Table 4 is that native trees (especially Pohutukawa) are important to kaka in December, and exotics (especially pines) are important in winter. The data tell us nothing about de-predations on orchards, or the economic effects, although they indicate a problem for anyone trying to grow fruit commercially – we already knew that! The point is that having numbers shifts the argument to a new level – for example the data support the view that pines are probably the most important food source for kaka in the winter. This knowledge should be used to formulate new ecosystem management practices to balance the kaka population numbers at a sustainable level - which also allows humans to grow fruit. Currently kaka are the meat in the sandwich in a conflict between conservation aims, and the legitimate aspirations of many fruit tree owners on Great Barrier.
That is not a good place for kaka, or for anyone else.

Fig 1. Number of participants covering all five counts.

Table 1. Kaka count results 26/12/2010

Table 2. Kaka population estimates.
Notes for GBICT counts: (1) July 2006. (2) Average Sept. 2006 and 2007. (3) Sept. 2007. For Glenfern: (1) Aug 2004.
(2) Average Sept. Oct. 2005, 2006. (3) Average Jan 2002 & 2003. (4) Rank of conspicuousness,
1 = most conspicuous, 2 = next most etc.

Fig 2. Mean, maxima and minima estimates of kaka counts based on locations. Winter counts in white, summer counts in grey. The bars give the average, the thin lines give the maxima and minima (“Error bars”).

Table 3. Probability (% frequency) of seeing or hearing a kaka (at any distance) in a five minute stop in different locations on Great Barrier. Data from GBICT bird counts 2006-2008 and Glenfern Sanctuary 2002–2006.
Notes: nc = not counted.
(1) This minimum is the maximum actually counted by one of the observers at a ‘location’ (i.e. at least this number was definitely present at the location).
(2) This maximum is based on either the maximum actually counted by an observer at the location or (usually) the estimate of numbers usually seen by the observer over the last two weeks.
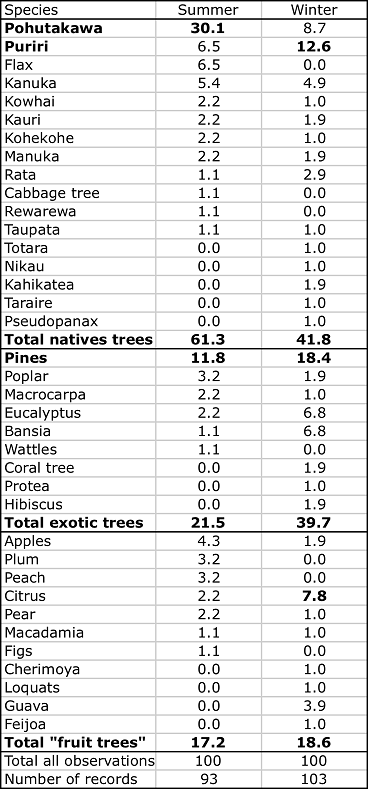
Table 4. Relative frequencies of records of trees visited by kaka (from all five data sets).